November 01, 2018
The Civic Federation conducts an analysis of the Chicago Transit Authority’s annual proposed budget each year. This analysis includes two measures used to assess CTA’s productivity over time: labor cost per actual unlinked passenger trip and operating expense per passenger mile.[1] The data used to calculate the productivity measures are obtained from the annual budget documents.
As discussed in previous years, the labor cost per unlinked passenger trip is a metric in which a lower dollar amount equals higher productivity. In FY2019, productivity is projected to decline as the labor cost increases to $2.35 per unlinked passenger trip, following a five-year trend. This is an increase of $0.09 between FY2018 and FY2019, as well as an increase of $0.41 since FY2015. The chart below presents these trends.
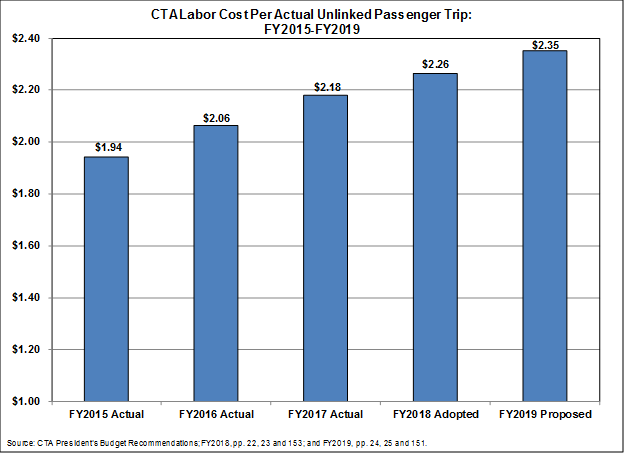
This decrease in productivity is due also to declining ridership. Ridership has fallen by 2.1% on average each year since FY2015, whereas labor costs have increased by 2.3% on average each year. The CTA attributes the decline in ridership to extreme winter weather in FY2015, competition from alternative transit providers such as Uber and Divvy, and low fuel prices from FY2016 to FY2018, which encouraged more car usage.[2]
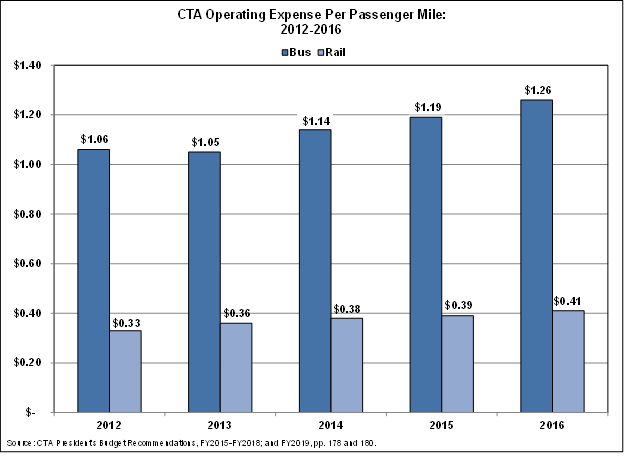
The chart below illustrates operating expense per passenger mile for bus and rail service between 2012 and 2016, the most recent years for which data is available. Within transit systems, rail service is commonly more cost effective than bus service due to higher ridership on trains. The CTA reports the operating expense for rail service has increased from $0.33 in FY2012 to $0.41 in FY2016. The operating expense for bus service has increased by $0.20 during this period. It dipped from $1.06 in FY2012 to $1.05 in FY2013, before increasing to $1.26 per passenger mile in FY2016.
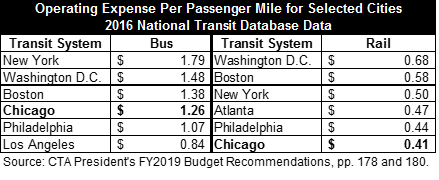
Chicago’s rail system remains the lowest cost among peer cities at $0.41 per passenger mile, $0.27 lower than the highest cost per passenger mile in Washington, D.C. Additionally, Chicago’s bus system has a cost of $1.26 per passenger mile, third lowest among its peers and $0.53 lower than the highest cost per passenger mile in New York City. The table below presents this data.
The Civic Federation will be releasing its full analysis of the Chicago Transit Authority’s FY2019 Recommended Budget next week.