
September 07, 2018
As part of an ongoing series about local governments in Illinois, this blog post will examine the revenues and expenditures of counties located in Illinois and a comparison of county population data within Illinois and across states. The revenue and expenditure data is self-reported to the Illinois Comptroller’s Office and incorporated into the Comptroller’s statutorily required Fiscal Responsibility Report Card for 2016, the most recent data available. The county population data is accessed through the U.S. Census Bureau’s population estimates and the 2012 Census of Governments, which is also the most recent data available.
Revenues and Expenditures for Counties in Illinois
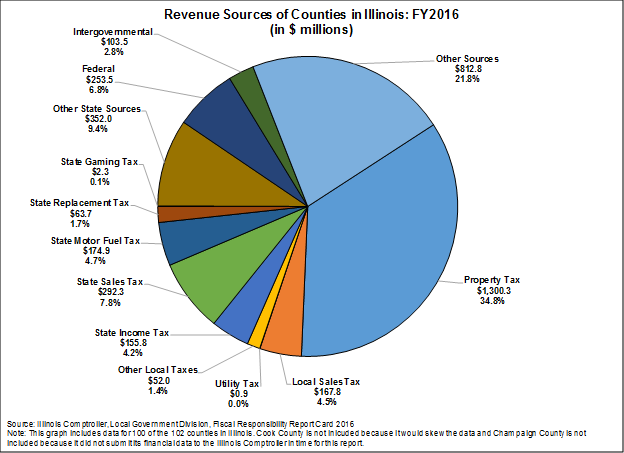
The Illinois Comptroller reports that the combined revenue for 100 of the 102 counties in Illinois totaled $3.7 billion, or 12.7%, of all local government revenue in FY2016.[1]
The pie chart below shows the combined revenue of the 100 counties in Illinois that are included in the Comptroller’s 2016 Fiscal Responsibility Report Card. Of the $3.7 billion in total revenue collected by the 100 counties, $1.3 billion, or 34.8%, of the revenue was derived from property taxes. Other sources of revenue, which includes licenses & permits, fines & forfeitures, charges for services, interest and miscellaneous income totaled $812.8 million, or 21.8% of the combined revenue for counties. State sources, which includes the replacement tax, state income tax, state sales tax, and other items composed nearly 28.0%, or $1.0 billion in revenue. Federal revenue sources made up $253.5 million, or 6.8%, of revenues for the 100 counties included in the chart.
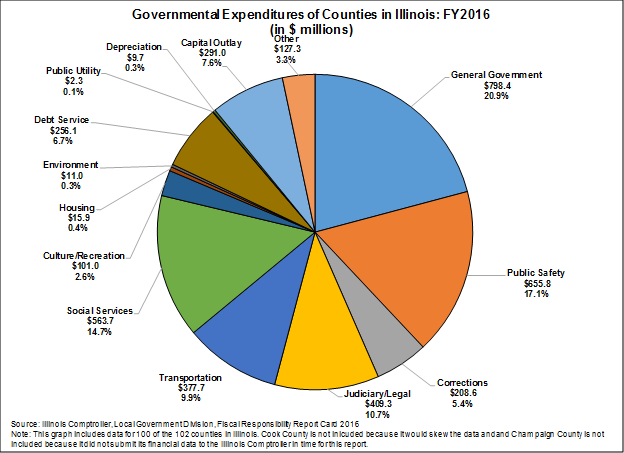
The next chart shows the combined governmental expenditures of 100 of the 102 counties in Illinois.[2] The 100 counties included in the chart below spent a total of $3.8 billion in FY2016. The largest category of spending was general government, which totaled $798.4 million or 20.9%. Public safety, corrections and judiciary/legal collectively composed nearly $1.3 billion, or 33.3%, of total governmental expenditures for counties in Illinois. County spending on social services totaled $563.7 million, or 14.7% of total county expenditures. Transportation spending accounted for $377.7 million, or 9.9% of spending by counties in Illinois. The remainder of spending by counties, which includes culture/recreation, housing, environment, debt service, public utility, depreciation, capital outlay and other, totaled $814.3 million, or 21.3%, of spending by counties in Illinois in FY2016.
Comparison of Counties and Populations
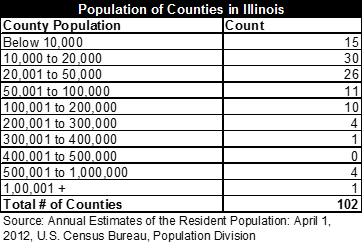
The next chart provides a summary of the 102 counties in Illinois broken down into population categories. According to the U.S. Census Bureau’s 2012 population estimate, there are a total of approximately 12.8 million residents in Illinois. Cook County has the largest population of all counties at 5.2 million residents. The five collar counties (DuPage, Will, Lake, Kane and McHenry) have a population of 3.1 million residents. The entire six county region of northeastern Illinois composes 65.0% of the total state population at nearly 8.4 million residents.
Of the 102 counties in Illinois, there are 15 counties that have a population of less than 10,000 residents. There are 82 counties that have a population less than 100,000 residents, 15 counties that have a population between 100,001 and 500,000 and five counties with a population greater than 500,000 residents.
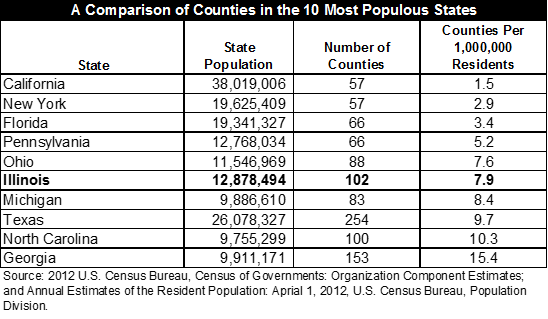
The final chart provides a comparison of population and the number of counties in the 10 most populous states. Illinois has the largest number of local governments among states by far at 6,963 local governments statewide, but it is average when comparing the number of counties to other high population states. Texas has the most counties of all 50 states with a total of 254, followed by Georgia with 153 and then Illinois with 102 counties statewide. On the other end of the spectrum, California, which has the highest population of all 50 states with a total of approximately 38 million residents only has 57 counties. Conducting a comparison of counties per 1,000,000 residents, California has the fewest number of counties per 1,000,000 resident at 1.5 and Georgia is at the other end with 15.4 counties per 1,000,000 residents. Illinois is in the middle of the pack of the selected states displayed in the chart at 7.9 counties per 1,000,000 residents.
A forthcoming Civic Federation report will provide a comprehensive inventory of all local governments in Illinois.
Related Links:
An Examination of the Finances of Illinois Community Colleges
The Multiplicity of Local Governments in Northeastern Illinois
School Districts and Property Taxes in Illinois
[1] Cook County is not included because it would skew the data because of the size of its budget and Champaign County is not included because it did not submit its financial data to the Illinois Comptroller in time for this report.
[2] Cook County is not included because it would skew the data. Champaign County is not included because it did not submit its financial data to the Illinois Comptroller in time for this report.