May 05, 2011
Among the many challenges facing City of Chicago Mayor-elect Rahm Emanuel when he takes office May 16 is the precarious state of the City’s finances. The City has a large and increasing direct debt load that could be a major indicator of financial risk. Long-term debt consists of tax-supported debt issues such as general obligation bonds and notes as well as bond premium and issuance costs.
Long-term direct debt is a measure of a government’s ability to maintain its current financial policies into the future. The major rating agencies, including Fitch Ratings and Moody’s, take into account a government’s debt load when assessing that government’s bond rating. In its “Financial Challenges for the New Mayor of Chicago” report, the Civic Federation profiled the City’s direct debt per capita. This blog post provides additional information about the City’s debt situation, including a comparison of the City’s debt load to other governments in the Chicago region and a summary of the City’s debt service appropriations.
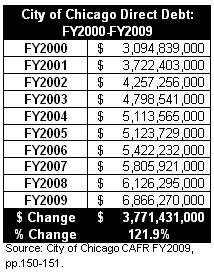
The chart below presents 10-year trend information for the total amount of City of Chicago net direct debt. During that time, total net direct debt rose by 121.9% or $3.8 billion, from $3.1 billion in FY2000 to approximately $6.9 billion in FY2009.
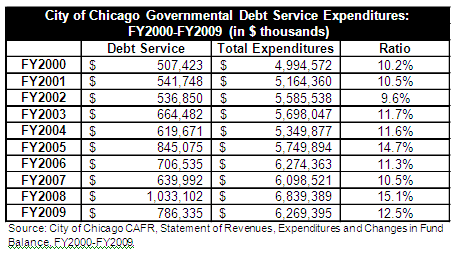
Debt Service Appropriations
Debt service includes principal retirement, interest and other fiscal charges. The ratio of debt service expenditures as a percentage of total Governmental Fund expenditures is used to assess debt burden. Debt service payments at or exceeding 15-20% of all expenditures are generally considered high by the rating agencies. City debt service expenditures in FY2009 were 12.5% of total expenditures, or $786.3 million out of expenditures totaling $6.3 billion.
Long-Term Net Direct Debt Per Capita
Direct debt per capita is a common ratio used by rating agencies and other public finance analysts to evaluate long-term debt. In Chicago, between FY2005 and FY2009, direct debt per capita rose by 34.0% from $1,769 to $2,371. This upward trend is part of a ten-year increase in the City of Chicago’s debt per capita of 121.9%, which is a $1,302 per capita increase. The following chart shows the increase in the City of Chicago’s direct debt per capita over the last decade.
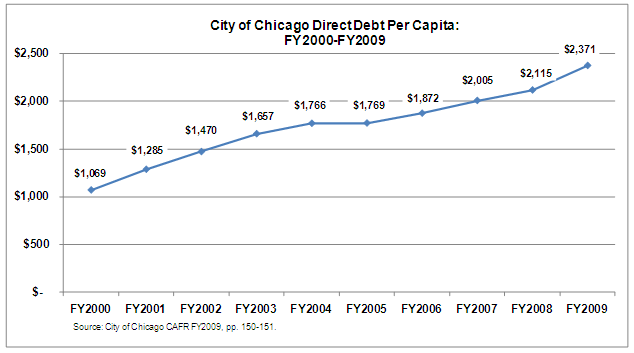
This sharp upward trend in debt per capita between FY2000 and FY2009 is cause for concern for the City of Chicago. It threatens to further reduce the City’s credit rating, making borrowing more expensive, and could limit available capacity for additional borrowing.
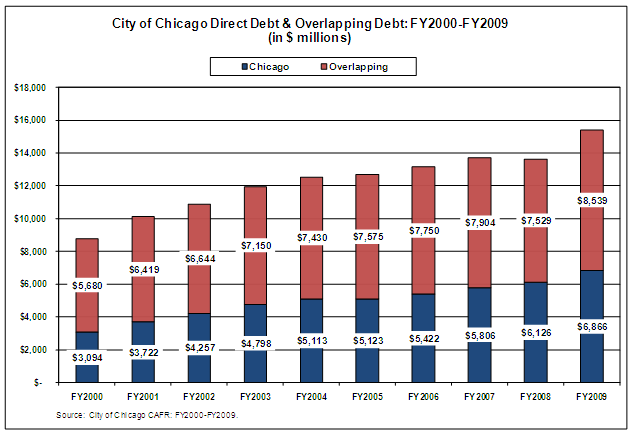
Overlapping Debt: Chicago vs. Other Governments
This next chart compares total City of Chicago net direct debt with overlapping net debt reported by seven other major Cook County governments with boundaries coterminous with the City of Chicago or located partially within its boundaries. These governments are: the Chicago Public Schools, Cook County, the Forest Preserve District of Cook County, the Metropolitan Water Reclamation District, the Chicago Park District, the City Colleges of Chicago and the School Finance Authority. Rating agencies and other financial analysts commonly monitor overlapping debt trends as an affordability indicator when governments consider debt issuance. Between FY2000 and FY2009, combined overlapping debt from other governments combined increased by 50.3% at the same time City of Chicago debt rose by 121.9%. Combined total debt from all eight major governments rose by 75.6%. The rate of increase in direct debt issued by the City of Chicago has far outpaced the increase for the other governments in the region.