
March 28, 2013
This blog continues the Civic Federation’s examination of indicators that can be used to measure the financial health of local governments. In order to measure financial condition, it is important to assess the direction and magnitude of changing ratios over time. The Federation is analyzing the five most recent Comprehensive Annual Financial Reports (CAFR) of thirteen large U.S. cities, most of which have also been the subject of analysis by the Pew Charitable Trusts’ Philadelphia Research Initiative.[1] The Federation’s analysis focuses on the City of Chicago’s performance during those years. Previous entries over the past year examined the City of Chicago’s fund balance ratio, continuing services ratio, operating deficit ratio, debt service expenditure ratio and current ratio using audited financial data from FY2006-FY2010. This blog examines the working capital to expenses ratio from FY2007-FY2011, the most recent years for which audited financial data is available.
Working Capital to Expenses Ratio
Working capital is a measure of operational liquidity and assesses whether the government has the means available to cover its existing obligations in the short run. Working capital can be thought of as a budgetary buffer if there are fluctuations in cash flow. When divided by monthly expenses, the working capital to expenses ratio can approximate how many months the government is able to maintain normal operations with its current level of resources. An increase in the working capital to expenses ratio over time may reflect increasing current net assets or decreasing annual expenses, both of which can generally be considered fiscally sound outcomes.[2] As such, a high rank with this indicator is favorable.
The formula for the indicator is the following:
Current Assets – Current Liabilities
1/12 Expenses
Source: Government-Wide Statement of Net Assets
The working capital to expenses ratio formula uses the current assets of a municipality, including:
- Cash and cash equivalents: assets that are cash or can be converted into cash immediately, including petty cash, demand deposits and certificates of deposit;
- Investments: any investments that the government has made that will expire within one year, including stocks and bonds that can be liquidated quickly;
- Receivables: monetary obligations owed to the government including property taxes and interest on loans;
- Internal balances: monies due from (positive) or due to (negative) the government; and
- Inventories: government-wide inventories.
Current liabilities are financial obligations that must be satisfied within one year. These may include items categorized as long-term liabilities due within one year, or the current portion of long-term liabilities.[3] The working capital to expenses ratio formula uses the following current liabilities of a municipality:
- Payables: monies owed to vendors for goods and services;
- Short-Term Debt: loans taken out in anticipation of revenues that are paid back within 12 months or fewer;
- Accrued Interest: includes interest due on deposits payable by the government in the next fiscal year; and
- Accrued and Other Liabilities: includes self insurance funds, unclaimed property and other unspecified liabilities.
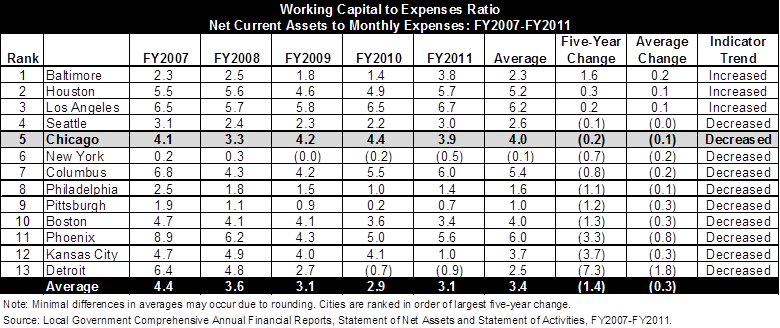
The chart below compares the working capital to expenses ratio for 13 U.S. cities between FY2007 and FY2011, the most recent years for which data is available for all of the cities. The City of Chicago’s working capital to expenses ratio averaged 4.0 months and decreased by nearly 0.2 months over the five-year period. At its lowest point in FY2008, the City’s government-wide working capital to expenses ratio dropped to 3.3 months, which is still well above the GFOA’s recommended 1.5 months of working capital for the enterprise funds. In other words, at any point during the fiscal year 2008, the City had enough working capital to fund approximately 3 months and one week of operations.
The working capital to expenses ratio reveals that while only two of the 13 cities experienced increases in the ratio over the five-year period, most cities maintained relatively healthy net current assets compared to monthly expenses. Only two of the 13 cities – New York and Pittsburgh – had average working capital to expenses ratios below the GFOA’s recommended level for enterprise funds. (Click to enlarge.)
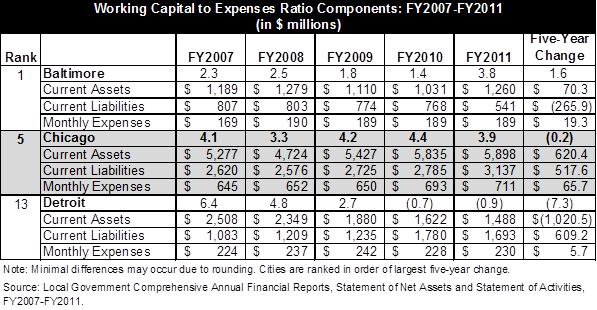
To help explain the fluctuations in the working capital to expenses ratios above, the exhibit below shows each of the components of the ratio for Chicago and the highest and lowest ranked cities from FY2007 to FY2011. The slight dip in Chicago’s ratio in FY2008 can be attributed to a $553.4 million, or 10.5%, decrease in unrestricted current assets. This includes a decrease of nearly $200.0 million in cash and cash equivalents and a loss of $351.3 million in investments government-wide.[4] These losses are in part a result of debt financing used to support the City’s capital improvement program in 2008.[5]
Baltimore’s working capital per expense ratio increased by 1.6 months from FY2007 to FY2011, ranking it first among the 13 cities. The increase is largely due to a $265.9 million, or 33.0%, decline in current liabilities over the five-year period.[6]
In the City of Detroit, the working capital to expenses ratio fell significantly from FY2007 to FY2011. In FY2010 the ratio dropped to a deficit of 0.7 months and further fell to a deficit of 0.9 months in FY2011. These deficits occurred because the City experienced significant declines in current assets and increases in current liabilities. Over the five year period, current assets fell by $1.0 billion, or 40.7%, from $2.5 billion in FY2007 to $1.5 billion in FY2011. At the same time, current liabilities grew by $609.2 million, or 56.2%, from $1.1 billion to nearly $1.7 billion.[7] (Click to enlarge.)
[1] Due to a change in the fiscal year for the City of Atlanta in 2006 that led to inconsistent preliminary trend analyses, the report substitutes the City of Houston for Atlanta.
[2] Although the Government Finance Officers Association (GFOA) does not discuss working capital benchmarks for the primary government as an aggregate of governmental and proprietary activities, the GFOA does recommend appropriate levels of working capital in the enterprise or business-like funds. The GFOA recommends that a government’s target for working capital be no less than 45 days worth of annual operating expenses, or approximately 1.5 months. See Government Finance Officers Association, “Appropriate Levels of Working Capital in Enterprise Funds,” 2011.
[3] The current portion of long-term debt is the portion of a long-term obligation that will be settled during the next year by using current assets. Steven M. Bragg, Interpretation and Application of Generally Accepted Accounting Principles (New Jersey: Wiley, 2011), 39.
[4] City of Chicago, Comprehensive Annual Financial Reports, FY2007 and FY2008, p. 29.
[5] City of Chicago, FY2008 Comprehensive Annual Financial Report, p. 16.
[6] City of Baltimore, Comprehensive Annual Financial Reports, Statement of Net Assets, FY2010 and FY2011.
[7] City of Detroit, Comprehensive Annual Financial Reports, FY2007-FY2011.