
June 29, 2012
Despite increased revenues from higher income tax rates and a slight improvement in tax receipts due to some economic stabilization, the State of Illinois’ audited financial statements indicate fiscal deterioration continued through the end of FY2011.
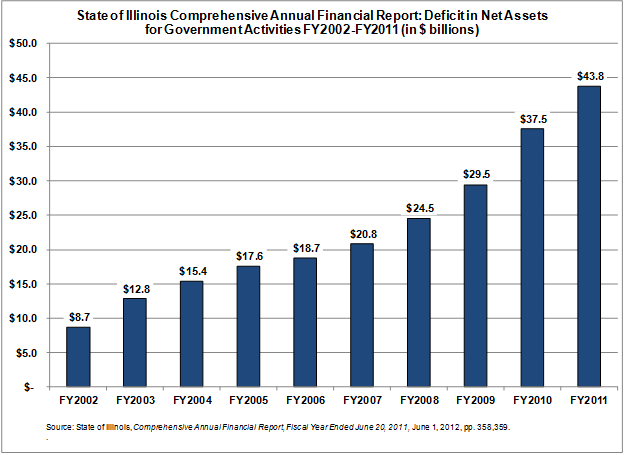
Increased bonded debt and long-term liabilities due to underfunding of the State’s retirement systems far outpaced growth in capital assets and fund balances, leading to a total deficit in Illinois’ net assets for governmental activities of $43.8 billion at the end of FY2011, which is an increase of $6.8 billion, or 16.7%, from the FY2010 total of $37.5 billion.
The Illinois Comptroller published the State’s audited FY2011 Comprehensive Annual Financial Report (CAFR) on June 1, 2012, nearly a year after the fiscal year ended on June 30, 2011. The broadest measure of the State’s financial health from year to year is reported in the document’s statement of net assets. The table presents the State’s total governmental assets at the end of the year compared to its total liabilities incurred, including expenses that are due immediately and long-term obligations.
According to the statement of net assets in the FY2011 CAFR, the State’s government assets totaled $36.9 billion, compared to total liabilities of $80.7 billion. Capital assets owned by the State including roads, buildings and land made up the largest portion of the State’s assets, valued at $20.1 billion. The largest liability of the State was a total of $28.0 billion in outstanding General Obligation Bonds, followed closely by the second largest liability, net pension obligations (NPO) totaling $24.0 billion.
As shown in the following chart, the State’s deficit in net assets has increased every year throughout the last decade, resulting in an increase of more than 400% from $8.7 billion in FY2002 to $43.8 billion in FY2011.
The State can expect continued annual deficits in its net assets due to the State’s funding plan for its retirement systems. In calculating the State’s NPO according to the rules set forth by the Governmental Accounting Standards Board, the State must take into account the difference between the annual payment actually made to its retirement systems and the actuarially required contribution (ARC). The ARC is the calculated payment that would fully fund the annual cost of the program and amortize the unfunded liability over 30 years. This amount is combined with any underfunding from previous years and interest on the annual and past shortfalls. The State’s current statutory funding plan for its retirement systems only targets 90% funding over 50 years. Thus the plan, which began in FY1996, does not meet the ARC calculation of 100% funding over 30 years. Thus each year the State’s NPO grows as it continues to fund below the ARC and accrue additional liabilities and interest on those liabilities. Unless the State changes the length and targeted funding ratio included in the pension statute, it is unlikely to be able to close this deficit in net assets.
Because of the focus on long-term liabilities compared to assets rather than revenues compared to expenditures, the statement of net assets differs greatly from the State’s annual operating budget. However, the CAFR includes a review of the State’s annual General Funds revenues and expenditures, which reflect the results of the enacted budget. The total General Funds expenditures were $32.5 billion based on revenues of $33.6 billion resulting in an operating surplus of $1.1 billion. However after accounting for the required transfers in and out of the General Funds the surplus was reduced to $737.9 million. This amount was applied to the $8.8 billion General Funds deficit that was carried over from FY2010 for a year-end deficit of $8.1 billion in FY2011.
Despite the slight decline in the total General Funds deficit at the end of FY2011, year-end results were more than double the total deficit in FY2008 of $4.0 billion and 174.0% higher than 10 years earlier in FY2002. This dramatic increase in the General Funds deficit illustrates the State’s ongoing struggle to generate enough revenue annually to support its operations.
The following chart shows the General Funds deficit as reported in the FY2011 CAFR for FY2002 through FY2011.
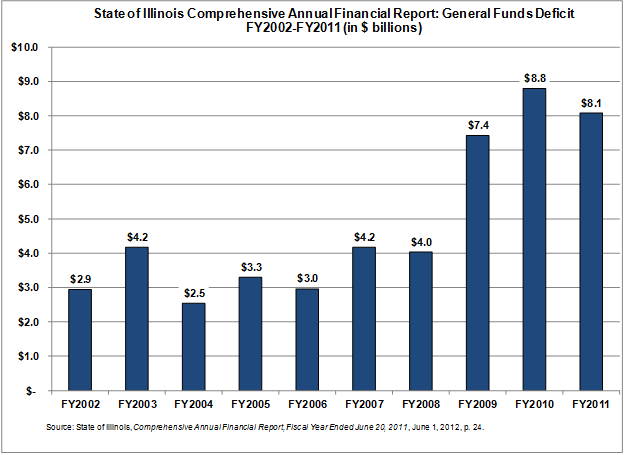
The General Funds deficits in the graph above were restated in the FY2011 CAFR from amounts previously reported for all years except FY2004, for a variety of reasons including overestimated revenues, underestimated expenses and reclassification of funds now excluded from the General Funds.