
October 06, 2023
In this blog post, the Civic Federation analyzes indicators of the fiscal health of the City of Chicago’s four pension funds based on the most recent FY2022 actuarial reports, dated December 31, 2022. The City of Chicago’s pension funds are severely underfunded due to a combination of statutory underfunding, benefit enhancements, investment losses, optimistic assumptions and other long-term problems. In 2016, the City’s four pension funds began transitioning per State law to 40-year funding plans. Pursuant to State statute, the plans started with five-year ramps of growing annual contributions before transitioning to a 35-year schedule of actuarially calculated contributions, which will increase their funded ratios to 90%. All four funds started their ramps and transition process to an actuarially calculated funding plan in different fiscal years, but as of FY2022 all four are funded on an actuarially calculated basis. The City will make annual contributions to each of the funds based on their financial needs. However, due to the length of the funding schedule and its backlogged nature, the City is not required to make sufficient contributions to reduce the unfunded liability until between 2028 and 2035.[1] For this reason, the City made an advance pension payment in FY2023. The City’s Budget Forecast for FY2024 states that the City plans to make another advance pension payment in FY2024.
Membership
Trends in pension fund membership can indicate whether more financial stress on a pension fund can be expected due to changes in the number of employees paying into the fund over time. For FY2022, the City of Chicago’s total active employee membership for all four pension funds was 54,306, which is an increase of 2,328, or 4.3% from the FY2021 total active employee membership of 51,978. The Municipal Fund has the largest number of active employees at 35,137, or 65% of the total for all four funds. Nearly 61% of the Municipal Fund members as of December 31, 2021 were non-teacher employees of Chicago Public Schools. The Laborers’ Fund has the smallest number of active employees at 2,534, or 4% of the total. The following chart shows the number of active employees as a percentage of the total active members.
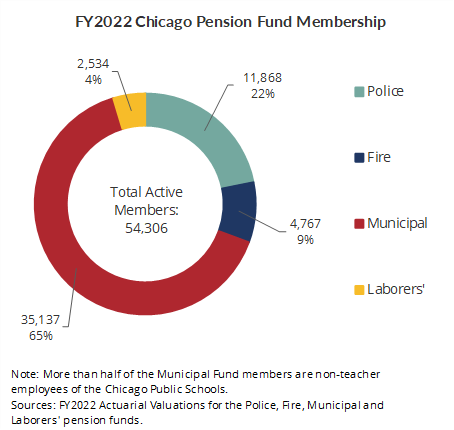
The Municipal Employees fund, which is the city’s largest pension fund, is the only one of the four funds that has more active employees paying into the fund than beneficiaries receiving benefits. The number of beneficiaries, or those receiving pension benefits, across the four pension funds was 49,682 as of FY2022. A low ratio of active employees to annuitants means there are fewer employees paying into the fund and more retirees taking annuity payments out of the fund. This can be a signal of distress for mature and underfunded pensions like the four Chicago funds, where additional employer contributions will be needed to make up the difference. The Police Fund had a ratio of 0.81 in FY2022 compared to 0.85 the prior year. The Laborers’ Fund ratio slightly increased in FY2022 from FY2021, and the Municipal Fund ratio significantly increased to 1.34 in FY2022 compared to the FY2021 total of 1.26. Lastly, the Fire Fund ratio remained flat in FY2022 compared to previous years. All four funds saw an increase in membership for Tier 2 and 3 compared to the prior year, but the Municipal Fund had the largest increase of Tier 2/3 members in FY2022 at 20,993, or 59.7% of total active members. The Police Fund saw the smallest increase of Tier 2 members in FY2022 for a total of 5,575, or 46.9% of active members.
Fiscal Indicators
Pension fund status indicators show whether funding is improving or declining over time and how well a pension fund is meeting its goal of accruing sufficient assets to cover its liabilities. Ideally, a pension fund should hold exactly enough assets to cover all its actuarial accrued liabilities (100% funded).
The Civic Federation analyzes three measures over time to evaluate pension funding status:
- Funded ratio;
- Unfunded actuarial accrued liabilities; and
- Investment rate of return.
Funded Ratio: The most basic indicator of pension fund status is its ratio of assets to liabilities, or “funded ratio.” In other words, this indicator shows how many pennies of assets a fund has per dollar of liabilities. For example, if a plan had $100 million in liabilities and $90 million in assets, it would have a 90% funded ratio and about 90 cents in assets per dollar of obligations to its employees and retirees.
When a pension fund has enough assets to cover all its accrued liabilities, it is considered 100% funded. This does not mean that further contributions are no longer required. Instead, it means that the plan is funded at the appropriate level at a certain date. A funding level under 100% means that a fund does not have sufficient assets on the date of valuation to cover its actuarial accrued liability.
Unfunded Actuarial Accrued Liability: Unfunded actuarial accrued liabilities (UAAL) are obligations not covered by assets. Unfunded liability is calculated by subtracting the value of assets from the actuarial accrued liability of a fund. For example, if a plan had $90 million in assets and $100 million in liabilities, its unfunded liability would be $10 million.
One of the purposes of examining the unfunded liability is to measure a fund’s ability to bring assets in line with liabilities. Healthy funds can reduce their unfunded liabilities over time. On the other hand, substantial and sustained increases in unfunded liabilities are a cause for concern.
Investment Return: A pension fund invests the contributions of employers and employees to generate additional revenue over an extended period of time. Investment income provides the majority of revenue for an employee’s pension over the course of a typical career. In addition to the actual annual rate of return, the assumed investment rate of return plays an important role in the calculation of actuarial liabilities. It is used to discount the present value of projected future benefit payments and has been the subject of considerable debate in recent years. The assumed rate of return for the four Chicago pension funds ranges from 6.75% for the Police and Fire funds to 7.0% for the Municipal Fund and 7.25% for the Laborers’ Fund. Other major contributors to a pension fund’s financial status in addition to employer contributions and investment returns are benefit enhancements and changes to actuarial assumptions.
Funded Ratio
This section uses two measurements of pension plan funded ratio: the actuarial value of assets measurement and the market value of assets measurement. These ratios show the percentage of pension liabilities covered by assets. The lower the percentage, the more difficulty a government may have in meeting future obligations.
The actuarial value of assets measurement presents the ratio of assets to liabilities and accounts for assets by recognizing unexpected gains and losses smoothed out over a period of three to five years. The market value of assets measurement presents the ratio of assets to liabilities by recognizing investments only at current market value. Market value funded ratios are more volatile than actuarial funded ratios due to the smoothing effect of actuarial value. However, market value funded ratios represent how much money is actually available at the time of measurement to cover actuarial accrued liabilities.
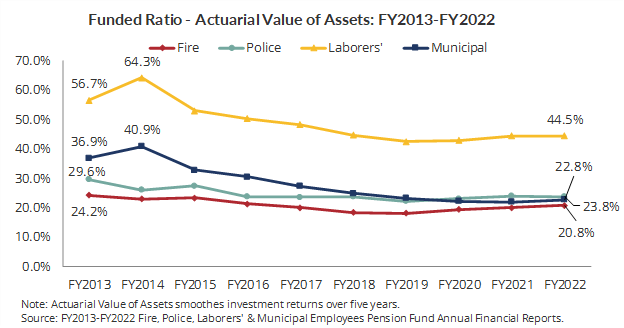
The following chart shows actuarial value funded ratios for each of the four pension funds. The actuarial value funded ratios for two of the four City pension funds increased in FY2022. The Fire Fund increased to 20.8%, the Municipal Fund increased to 22.8% and the Laborers’ Fund remained flat at 44.5%, but the Police Fund decreased to 23.8%.
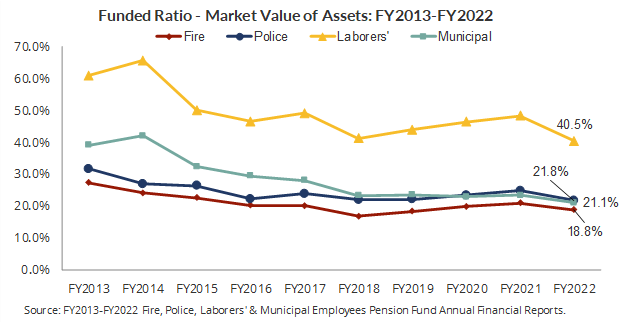
The following chart shows market value funded ratios for each of the four pension funds. The market value funded ratios have fluctuated since FY2013, but generally shown a downward trend. Liabilities have increased due predominantly to insufficient employer contributions and changes to actuarial assumptions, and the funds have experienced periodic investment losses. In FY2021, all four funds’ market value funded ratios increased due to high investment returns. However, in FY2022 all four funds’ market value funded ratios declined due to significant investment losses.
Unfunded Actuarial Accrued Liability
Over the past ten years, the unfunded liabilities of the four pension funds combined have grown by $13.8 billion, or 68.6%, from $20.1 billion in FY2013. The total unfunded liabilities of the four funds increased to nearly $34.0 billion in FY2022 from $33.3 billion in FY2021, or by 2.1%.
A summary of the ten-year changes in unfunded liabilities by fund is shown below:
- Fire Pension Fund: 84.6% increase, or $2.6 billion;
- Police Pension Fund: 68.2% increase, or $4.9 billion;
- Laborers’ Pension Fund: 49.2% increase, or $510.1 million; and
- Municipal Pension Fund: 65.7% increase, or $5.7 billion.

Investment Return
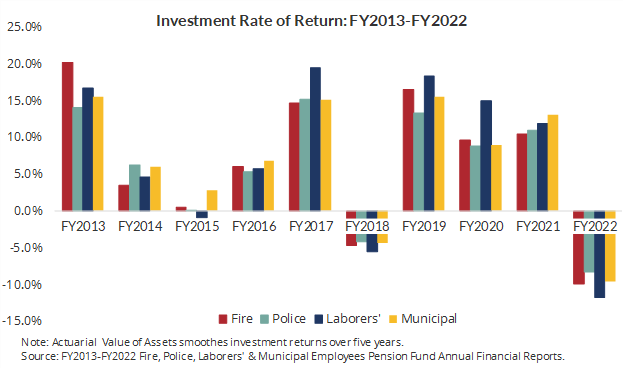
In FY2022, all four City pension funds experienced negative returns on their investments, ranging from -8.3% for the Police Fund to -11.8% for the Laborers’ Fund.[2] As noted above, the FY2022 investment assumption for the Police Fund was 6.75%, the Fire Fund rate of return was 6.75%, the Laborers’ Fund was 7.25% and the Municipal fund was 7.0%.
[1] See Fund Actuarial Valuations, 50-year funding projections. Backloading means that contributions are artificially low in the early years of the funding schedule and grow significantly in the out years.
[2] The Civic Federation calculates investment rate of return using the following formula: Current Year Rate of Return = Current Year Gross Investment Income/ (0.5*(Previous Year Market Value of Assets + Current Year Market Value of Assets – Current Year Gross Investment Income)). This is not necessarily the formula used by the pension funds’ actuaries and investment managers; thus investment rates of return reported here may differ from those reported in a fund’s actuarial statements. However, it is a standard actuarial formula. Gross investment income includes income from securities lending activities, net of borrower rebates. It does not subtract out related investment and securities lending fees, which are treated as expenses.