December 03, 2014
The Chicago Transit Authority (CTA) recently released its FY2015 proposed budget. While the Civic Federation traditionally analyzes features common to all local government budgets, our analyses of the Chicago Transit Authority’s (CTA) budgets include additional productivity measurement data. The Civic Federation uses expenditure, ridership and miles traveled data provided by the CTA to gain insight into changes in productivity.
The Civic Federation uses two measures to assess the CTA’s productivity over time: labor cost per actual unlinked passenger trip and operating expense per passenger mile.[1] The data used to calculate the productivity measures is obtained from the annual budget documents.
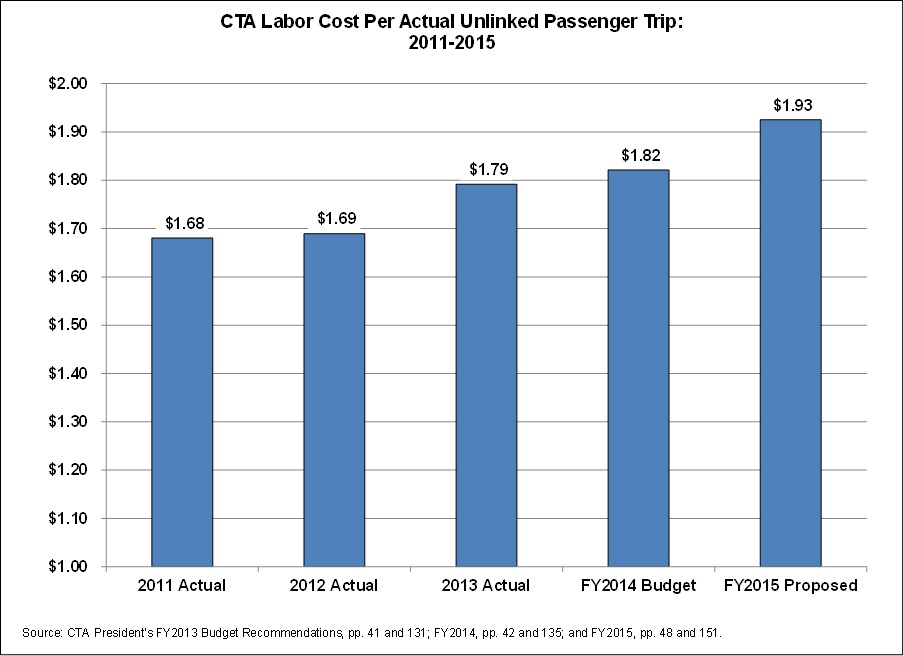
Labor productivity can be measured in terms of labor cost per unlinked passenger trip.[2] A lower dollar amount indicates higher productivity. The labor cost per unlinked passenger trip indicator increased steadily from $1.68 in FY2011 to $1.93 in FY2015.
Between FY2011 and FY2012, productivity stayed relatively even since ridership, which grew at 2.6%, nearly kept pace with increasing labor costs, which grew at 3.1%. However, between FY2012 and FY2013, the ratio increased by $0.10 per unlinked trip, from $1.69 to $1.79. This decrease in productivity can be linked to the 3.0% decrease in ridership, which was the result of track construction and increased rates for fare passes in FY2013. The labor cost per unlinked passenger trip is expected to increase between FY2014 and FY2015 by $0.11 from $1.82 to $1.93, which is due to a 3.3% increase in labor costs compared to 2.3% decrease in ridership over the previous year.
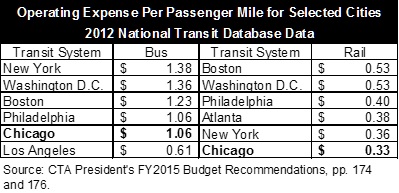
Another indicator that provides information about the productivity of the CTA’s operations is operating expense per passenger mile for bus and rail service. The latest data available for this indicator is provided for 2012 by the Federal Transit Administration’s National Transit Database Program. The CTA, in order to be eligible for grant funding from the Federal Transit Administration, must self-report data to the National Transit Database program.[3]
The chart below illustrates operating expense per passenger mile for bus and rail service between 2008 and 2012, the most recent years for which data is available.[4] As with all transit systems, rail service is more cost effective than bus service because there are higher ridership levels on rail service. The operating expense per passenger mile for rail service for 2012 is the lowest it has been in the past five years at $0.33.
The operating expense per passenger mile for bus has fluctuated over the last five years from a low of $0.96 in FY2008 then increasing to $1.06 in FY2009 before dropping to $1.01 for FY2010 and FY2011 before increasing to $1.06 again in FY2012.

For rail transit, CTA’s 2012 operating expense per passenger mile is comparable with the mass transit systems in other major cities. Chicago’s operating expense per passenger mile for bus service was the second lowest for cities examined. Chicago’s operating expense per passenger mile for rail service was the lowest among the cities examined.

The productivity measures for CTA show mixed results. The CTA’s productivity has declined in terms of labor cost per actual unlinked passenger trip; the operating expense per passenger mile for bus service has increased while the operating expense per passenger mile for rail service has declined.
[1] “Ridership” and “unlinked passenger trips” refers to total number of rides. Each passenger is counted each time that passenger boards a vehicle (bus or rail). CTA President’s FY2015 Budget Recommendations, p. 198;
[2] Labor cost per actual unlinked passenger trip is calculated by taking the total labor cost divided by the total system wide ridership.
[3] National Transit Database, http://www.ntdprogram.gov/ntdprogram/ntd.htm (last accessed December 3, 2014).
[4] Operating expense per passenger mile is calculated by taking the total operating cost divided by the total number of miles traveled by passengers.