
November 14, 2013
Over the past few years, the Civic Federation has blogged about financial indicators that can be used to measure the fiscal condition of local governments. The blogs were part of a larger ongoing project to assess the City of Chicago’s finances compared to twelve other major U.S. cities. On Friday, November 8, 2013, the Civic Federation released the product of this ongoing research project: a report that uses nine indicators of financial condition to measure the relative financial performance of Chicago and twelve other cities from FY2007 to FY2011. Of the cities analyzed, only Boston and Detroit consistently performed worse than Chicago by these metrics during the five-year period that encompasses the Great Recession and slow recovery.
The report analyzes the five audited financial statements of each of the cities from FY2007 to FY2011. Most of the cities chosen for the report have also been the subject of analysis by the Pew Charitable Trusts’ Philadelphia Research Initiative.[1] In addition to Chicago, the 12 other U.S. cities analyzed were Baltimore, Boston, Columbus, Detroit, Houston, Kansas City (MO), Los Angeles, New York, Philadelphia, Phoenix, Pittsburgh and Seattle. According to the Philadelphia Research Initiative, the group of cities combined the largest cities in the U.S., early industrial cities, geographically diverse cities and cities hit particularly hard by the recession.
In order to provide a comparative analysis in the simplest and most consistent manner, this report examines the relative outcome of each indicator by ranking the 13 U.S. cities by largest five-year change in each ratio.[2] The table below shows each city’s relative trend in financial condition based on the average of all nine indicators. The City of Chicago ranked eleventh of the 13 cities with an average rank of 7.4. Columbus ranked first with an average rank of 5.1 and Detroit ranked thirteenth with an average rank of 11.2. It is important to note that the top eleven cities’ average ranks were within a close range between 5.1 and 7.4. In other words, the cities’ rankings varied significantly with no city consistently out-performing the others. The exceptions are Boston and Detroit, which had trends that were relatively poor more consistently. For example, Pittsburgh, which ranked second overall, ranked first with three financial indicators, but also ranked ninth, eleventh and twelfth with other financial indicators.
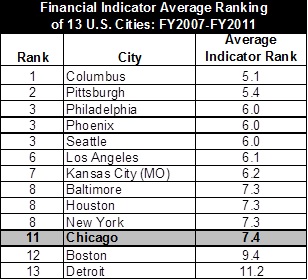
The next exhibit further illustrates the rankings presented above in order to show the close proximity of rankings for the top eleven cities.

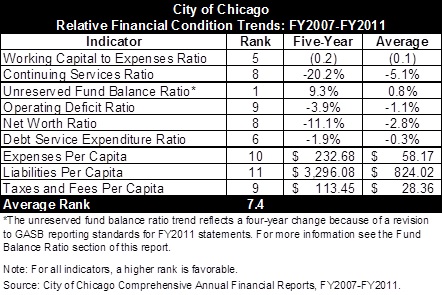
The table below shows the City’s ranking compared to the other cities, its five-year trend and its average ratio for each of the nine indicators. Based on six financial indicators, the City of Chicago ranked in the less favorable half of the 13 cities over the five-year period. Chicago performed in the more favorable half of the 13 cities based on three of the indicators. It is important to note that for all but one of the indicators, the debt service expenditure ratio, financial condition for a majority of the cities deteriorated over the five-year period. This is most likely due to the recession and its aftermath. However, despite an overall negative trend for all of the cities, Chicago’s financial condition relative to the other cities was poor.
Summary of Findings
During the five-year period, the City of Chicago’s relative financial condition has worsened compared to most of the 12 other cities in all four areas of solvency. Chicago’s ability to generate financial resources in the short-term has declined, indicating a weakened cash solvency. Its budgetary solvency is declining as well, with growing deficits in unrestricted net assets and in its Corporate Fund, which is its general operating fund. Also, although Chicago’s fund balance levels have increased over the five-year period, they were well below the GFOA’s recommended levels. The long-run solvency indicators expose significant challenges for the City to meet its existing long-term obligations. Despite the decline in the debt service expenditure ratio, the average over the five years for Chicago is among the highest of the 13 cities. Finally, with larger increases in real expenses and liabilities versus real taxes and fees, Chicago’s service-level solvency indicators suggest that the City is experiencing a growing imbalance between the demands of its citizens and the means to fund them.
Click the following PDF to read about the indicators and what they showed about Chicago’s relative fiscal performance.
Click here to read the Civic Federation’s Indicators of Financial Condition: A Comparison of the City of Chicago to 12 Other U.S. Cities.
[1] Due to a change in the fiscal year for the City of Atlanta in 2006 that led to inconsistent trend analyses, the Civic Federation’s report substitutes the City of Houston for Atlanta.
[2] A higher rank (1 being best) reflects improved performance for all indicators. For five indicators, the cities are ranked by largest positive change so that a high rank is considered improved performance. For four indicators, the cities are ranked by the largest negative change so that a high rank is considered improved performance. For more information, see the Rankings section of this report on page 8.