September 03, 2019
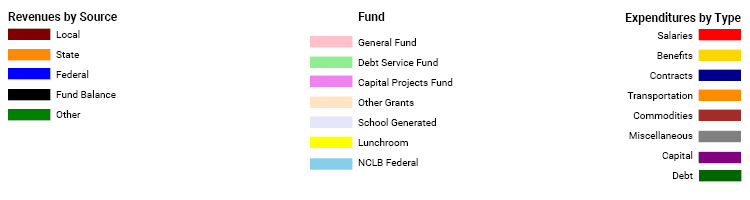
The Chicago Public Schools FY2020 Budget is an example of fund-based budgeting. Collected revenues are assigned to different funds intended to support various governmental functions. The interactive chart below is a Sankey diagram showing the flow of revenues through funds and to the District’s expenditures. A full analysis of the CPS FY2020 proposed budget can be found here.
The data is provided by CPS’ interactive budget website, and some revenue and spending categories are grouped for simplicity. Hovering over a revenue source will highlight which funds it flows into and in what amounts. Hovering over an expense category will show from which funds the payments are made. Hovering over a fund will highlight both the revenues and expenditures that flow through it.
In the chart, the width of the bands is proportional to the amount of money. The Sankey diagram makes it easy to visually compare the proportion of revenues coming from local, state and federal sources, and to see that CPS’ largest sources are property taxes and General State Aid (called “Evidence Based Funding” since 2017). Similarly, it shows that the largest operating expenditures are on salaries, pensions, and contractual payments to charter schools. Neither the Capital Projects fund nor the Debt Service Fund balance within a single year because of the use of prior year bond proceeds for capital construction and the pre-funding of subsequent year debt service.
Related Links:
FY2020 Chicago Public Schools Budget: Analysis and Recommendations