May 09, 2014
As part of the FY2015 budget recommendation for the State of Illinois, Governor Pat Quinn provided two separate five-year projections for both “recommended” and “not recommended” budget proposals. The long-term outlooks show the implications of the extension of higher income tax rates in the recommended budget and the considerable spending reductions that would be necessary to balance the State’s budget if the increases were allowed to roll back under the not recommended budget.
Under current law, the individual income tax rate that was increased on January 1, 2011 to 5.0% from 3.0% is scheduled to decrease to 3.75% on January 1, 2015 and to 3.25% on January 1, 2025. The corporate income tax rate was increased to 7.0% from 4.8% on January 1, 2011 and is scheduled to decline to 5.25% on January 1, 2015 and to 4.8% on January 1, 2025.
By showing how the budget would change based on letting the rates decline or extending the higher rates through FY2019, the five-year projections afford lawmakers the opportunity to see the implications of both paths as they craft the FY2015 budget.
Neither scenario eliminates the State’s backlog of unpaid bills by FY2019 but both reduce the total to $2.2 billion. The FY2015 budget shows the State’s backlog of unpaid bills totaling $5.4 billion at the end of FY2014. The recommended budget shows growth in both revenues and expenditures and uses moderate surpluses to pay down a portion of the bills. The not recommended budget significantly reduces agency appropriations as revenues decline and pays down the same amount of bills with surpluses created by the lower spending levels.
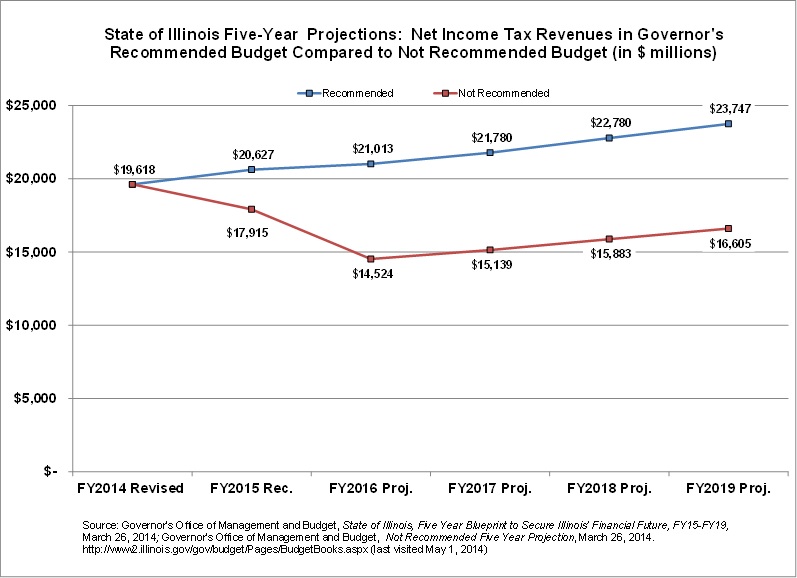
According to the projections, income taxes would be $2.7 billion less in FY2015, totaling $17.9 billion in the not recommended budget compared to $20.6 billion in the recommended budget. Income tax revenues decline even further in the not recommended FY2016 budget, totaling $14.5 billion after the first full year of the lower rates, or $6.5 billion less than the projection based on extending the higher rates.
It should be noted that the rate change is not the only factor that leads to the disparity between income tax revenues in the recommended and not recommended budgets. The recommended budget also includes the elimination of the Illinois property tax credit, which increases total income taxes in the recommended budget by $560 million. Income tax revenues are also reduced in the recommended budget because the amount set aside to pay for tax refunds increases. The recommended budget sets the diversion rate for individual income taxes at 9.5% while the not recommended includes a rate of 10.0%. The diversion rate for corporate income taxes is set at 13.4% in the recommended budget compared to 14.0% in the not recommended. The higher diversion rates reduce income tax revenues available to support General Funds spending in the not recommended budget by $105.7 million from the amount that would have been available at the diversion rates in the recommended budget.
By FY2019 the income tax revenues in the not recommended projection total $16.6 billion or $7.2 billion less than the total of $23.7 billion based on the recommended budget. In all, total income taxes collected over the five-year projection are $29.9 billion less in the not recommended budget compared to the Governor’s recommended budget.
The following graph compares the five-year projections of income tax revenues based on the Governor’s recommended FY2015 budget and the not recommended budget.
Income taxes make up more than 50% of General Funds revenues, so total General Funds resources show a similar difference between the recommended and not recommended budget in the five-year projections. Accordingly, the projections of General Funds expenditures based on the recommended budget increase over the five-year projection while the not recommended budget shows much lower expenditures in FY2015 and beyond.
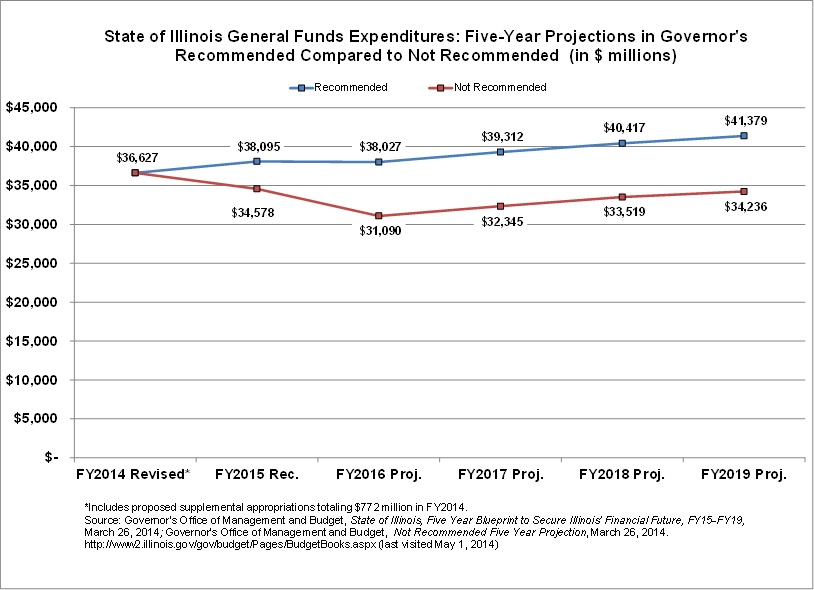
Total General Funds expenditures in the Governor’s recommended budget gradually increase from $36.6 billion in FY2014 to $41.4 billion in FY2019, a total of $4.8 billion or 13.0%. Conversely, expenditures in the not recommended budget decline dramatically over the first two years of the projection to $31.1 billion in FY2016 from $36.6 billion in FY2014, a decrease of $5.5 billion or 15.1% from FY2014. Expenditures in the not recommended budget grow marginally in the final three years of the projection to $34.2 billion by FY2019, but remain significantly below FY2014 levels.
The majority of the cuts in the not recommended budget are centered in education and human services appropriations. Funding for education is reduced by $2.3 billion, or 26.2%, to $6.4 billion in FY2016 from $8.5 billion in FY2014. Human services appropriations are reduced by $1.5 billion, or 28.2%, to $3.8 billion in FY2016 from $5.7 billion in FY2014.
The following graph compares the expenditure projections based on the Governor’s recommended FY2015 budget to the not recommended budget through FY2019.
The data in the five-year projection of the not recommended budget illustrate the potential revenue loss and budgetary stress that would be caused by the partial rollback of the income tax rates. However, the not recommended budget does not include concrete policy recommendations to achieve the reductions. Without significant changes to programmatic spending or elimination of existing government services, it is unlikely that the spending reductions in the not recommended budget would be met. By relying on appropriations that do not adequately fund known government costs, the State risks increases in annual deficits. In the past, the State has financed its operating deficits through costly borrowing and increasing its backlog of unpaid bills.
The Governor’s recommended FY2015 budget and five-year projections, although not balanced in the first year without interfund borrowing, do include specific policy recommendations to stabilize the State’s finances. However, the plan does not completely eliminate the State’s backlog of unpaid bills accumulated during the financial crisis that began in FY2009. Much of the revenue from the extension of the higher income tax rates through FY2019 is used to pay for new programs and additional agency spending.
As discussed here, the largest single new program is a homeowners’ grant of $500 for residential property owners that pay property taxes in the State, which has a net increased cost of $715 million after accounting for the revenues that are received due to the elimination of the current Illinois property tax credit. The total State cost of the grants is projected to be flat across the five-year projection.
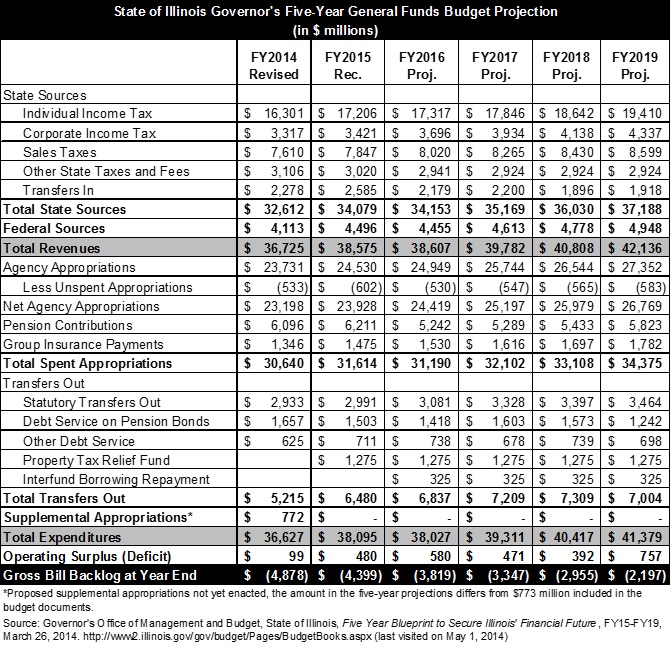
Net agency appropriations are projected to increase by $3.6 billion from $23.2 billion in FY2014 to $26.8 billion in FY2019. Due to the savings from the new pension law, the State’s required pension contributions decline by $969 million, or $15.6% in FY2016 to $5.2 billion from $6.2 billion in FY2015. The five-year projections show General Funds pension contributions totaling $5.8 billion in FY2019.
Despite the pension savings in the projection of the Governor’s recommended budget, the State only shows moderate surpluses from FY2015 through FY2019. These amounts are used to reduce the backlog of unpaid bills by $2.7 billion, to $2.2 billion by FY2019 from $4.9 billion in FY2014.[1] The amounts repaid in FY2015 through FY2017 are accelerated through interfund borrowing. The entire $480 million operating surplus in FY2015, which is used to pay down a portion of the backlog of unpaid bills, is made possible by interfund borrowing, as is $325 million of both the $580 million surplus in FY2016 and the $471 million surplus in FY2017. The borrowing in FY2016 and FY2017 is repaid in FY2018 and FY2019.
The following table shows the five-year projection of the Governor’s recommended FY2015 budget through FY2019. It should be noted that the five-year projections published by the Governor shows the backlog of bills totaling $4.9 billion at the end of FY2014 but the budget includes a total backlog of $5.4 billion. It is unclear what accounts for the difference.

[1] The gross backlog of unpaid bills is shown as $4.9 billion at the end of FY2014 in the Governor’s five-year projection but totals $5.4 billion in the FY2015 budget documents. The change in these liabilities is not explained.