
September 29, 2023
In this blog post, the Civic Federation analyzes indicators of the fiscal health of the Cook County pension fund based on the most recent FY2022 actuarial report as of December 31, 2022. Compared to many other pension funds in Illinois, Cook County’s pension fund is in more sustainable financial shape. This is due in large part to employer contributions made by the County above and beyond the amount required by state statute over the past seven years. The County began making supplemental pension payments in 2016, funded through a 1.0 percentage point increase in the County’s portion of the sales tax. These supplemental contributions were recently codified into state law through House Bill 2352, which was passed by the General Assembly in May 2023 and signed by the Governor in August 2023. Previously, the contributions were made through an intergovernmental agreement with the Cook County Pension Fund.
House Bill 2352 included a funding schedule to determine actuarially required contributions to help the County pension fund reach 100% funding in the next 30 years and allows the County to make its annual pension contributions from any tax source, not limited to property taxes. Additionally, the legislation resolved an issue related to federal Safe Harbor rules, which require pension benefits to be comparable to Social Security benefits. House Bill 2352 increases the maximum pensionable salary for employees hired since January 1, 2011, known as Tier 2 employees, in line with the Social Security Wage Base so that the maximum amount of pay used to calculate a pension for county employees will grow at the same rate as the Social Security pay cap over time. The County estimates that this will cost approximately $3 million each year over the next 30 years, for a present value cost totaling $98.8 million. The $3 million increase represents approximately 1% of the County’s total pension fund contribution made annually.
Membership Trend
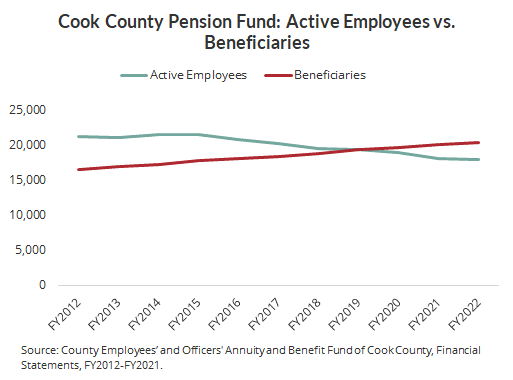
Trends in pension fund membership can indicate whether more financial stress on a pension fund can be expected due to changes in the number of employees paying into the fund over time. The number of active employees contributing to the Cook County pension fund has declined while the number of beneficiaries, or those receiving benefits, has increased. As of December 31, 2022, there were 17,933 active County employees participating in the pension fund, compared to 21,079 ten years earlier. And there were 20,311 beneficiaries, up from 16,885 in FY2013, resulting in a ratio of active employees to beneficiaries of 0.88. Prior to FY2020, the County fund had more employees than retirees, but that reversed in FY2019. A low ratio of active employees to annuitants means there are fewer employees paying into the fund and more retirees taking annuity payments out of the fund. This can be a signal of distress for a mature and underfunded pension like the County fund, where additional employer contributions will be needed to make up the difference.
Fiscal Indicators
Pension fund status indicators show whether funding is improving or declining over time, and how well a pension fund is meeting its goal of accruing sufficient assets to cover its liabilities. Ideally, a pension fund should hold exactly enough assets to cover all its actuarial accrued liabilities (100% funded).
The Civic Federation analyzes three measures over time to evaluate pension funding status:
- Funded ratio;
- Unfunded actuarial accrued liabilities; and
- Investment rate of return.
Funded Ratio: The most basic indicator of pension fund status is its ratio of assets to liabilities, or “funded ratio.” In other words, this indicator shows how many pennies of assets a fund has per dollar of liabilities. For example, if a plan had $100 million in liabilities and $90 million in assets, it would have a 90% funded ratio and about 90 cents in assets per dollar of obligations to its employees and retirees.
When a pension fund has enough assets to cover all its accrued liabilities, it is considered 100% funded. This does not mean that further contributions are no longer required. Instead, it means that the plan is funded at the appropriate level at a certain date. A funding level under 100% means that a fund does not have sufficient assets on the date of valuation to cover its actuarial accrued liability.
Unfunded Liability: Unfunded actuarial accrued liabilities (UAAL) are obligations not covered by assets. Unfunded liability is calculated by subtracting the value of assets from the actuarial accrued liability of a fund. For example, if a plan had $90 million in assets and $100 million in liabilities, its unfunded liability would be $10 million.
One of the purposes of examining the unfunded liability is to measure a fund’s ability to bring assets in line with liabilities. Healthy funds are able to reduce their unfunded liabilities over time. On the other hand, substantial and sustained increases in unfunded liabilities are a cause for concern.
Investment Rate of Return: A pension fund invests the contributions of employers and employees in order to generate additional revenue over an extended period of time. Investment income provides the majority of revenue for an employee’s pension over the course of a typical career. In addition to the actual annual rate of return, the assumed investment rate of return plays an important role in the calculation of actuarial liabilities. It is used to discount the present value of projected future benefit payments and has been the subject of considerable debate in recent years. The assumed rate of return for the Cook County pension fund is 7.0%, reduced in FY2021 from 7.25%. Other major contributors to a pension fund’s financial status in addition to employer contributions and investment returns are benefit enhancements and changes to actuarial assumptions.
Funded Ratio
There are two measurements of a pension plan’s funded ratio: the actuarial value of assets measurement and the market value of assets measurement. These ratios show the percentage of pension liabilities covered by assets. The lower the percentage, the more difficulty a government may have in meeting future obligations.
The actuarial value of assets measurement presents the ratio of assets to liabilities, accounting for assets by recognizing unexpected gains and losses smoothed out over a period of three to five years. The market value of assets measurement presents the ratio of assets to liabilities by recognizing investments only at current market value. Market value funded ratios are more volatile than actuarial funded ratios due to the smoothing effect of actuarial value. However, market value funded ratios represent how much money is actually available at the time of measurement to cover actuarial accrued liabilities.
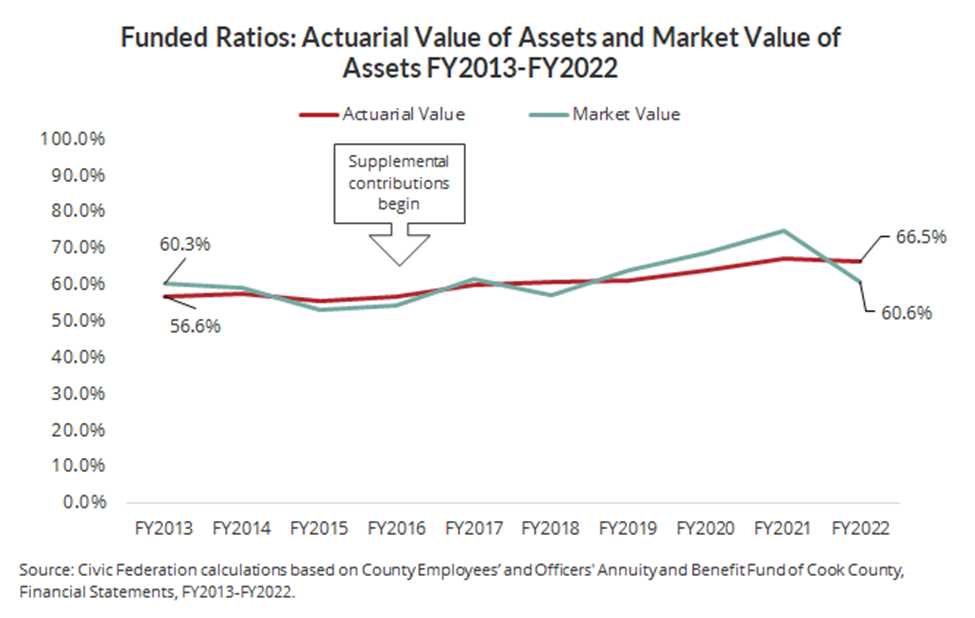
The following chart shows both the actuarial and market value funded ratios for the Cook County pension fund over the ten-year period between 2013 and 2022. The actuarial value funded ratio has risen steadily over this period from 56.6% in FY2013 to 66.5% in FY2022. There was a slight decline in FY2022 from the FY2021 funded ratio of 67.2% due to investment losses. The market value funded ratio declined in FY2022 to 60.6% from the prior year funded ratio of 74.8% following high investment returns in FY2021 and significant investment losses in FY2022. The difference between the investment losses experienced on an actuarial versus a market basis is due to the fact that the market value funded ratio takes into account the entire investment loss in one year, whereas the actuarial value of assets only accounts for part of the loss; the rest of the investment loss will be factored into the value of assets over the next four years due to the smoothing effect.
Prior to FY2016, the funded ratio had been declining for many years, but the funded ratio has generally increased since the County began making supplemental pension contributions in FY2016, funded through a 1.0 percentage point increase in the sales tax rate.
Unfunded Actuarial Accrued Liability
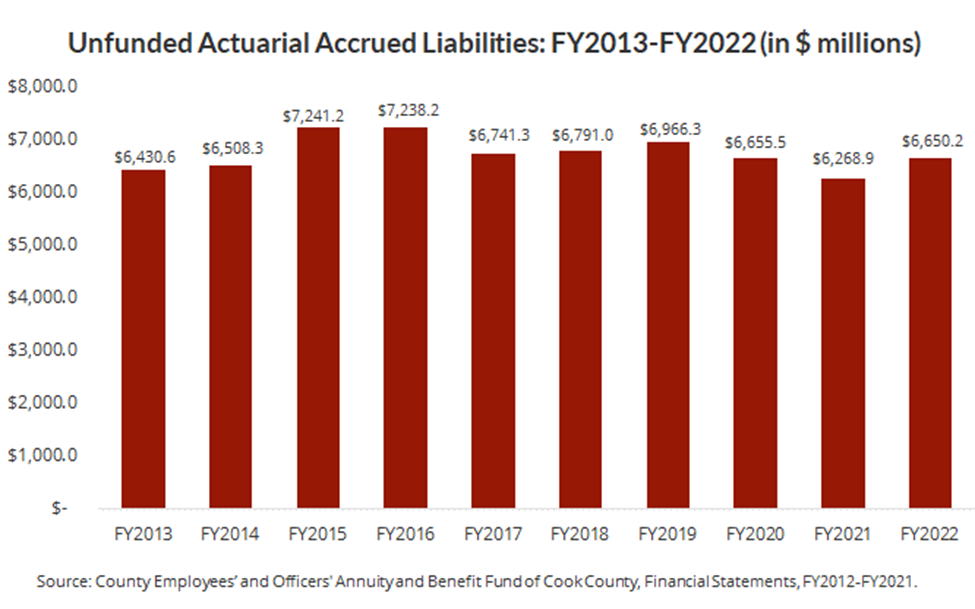
The unfunded liabilities of the pension fund increased to $6.7 billion in FY2022 from $6.3 billion in FY2021 due to investment losses experienced in 2022, which resulted in a loss of $408.3 million in assets and an increase in the unfunded liability of $276.3 million. Over the past ten years, the unfunded liabilities of the pension fund have increased by $219.6 million, or 3.4%. Liabilities for the County pension fund include other post-employment benefits (OPEB), which are discussed further below.
Investment Return
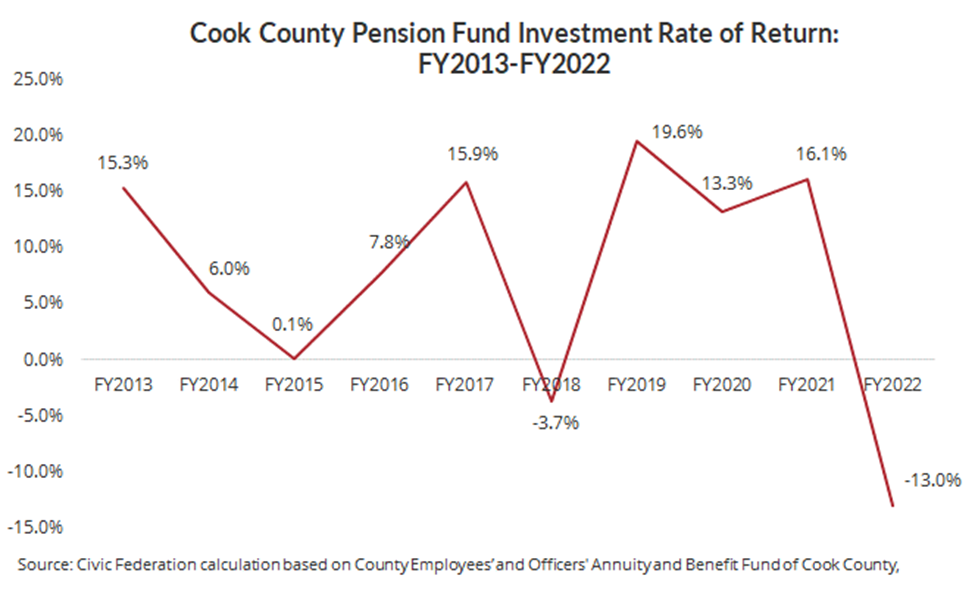
In FY2022 the County pension fund experienced investment losses of approximately 13%.[1] Negative returns in 2022 were in line with other pension funds in the Chicago area and around the country due to stock market losses. The County’s investment return assumption for the year was 7.0%, meaning that actual returns performed much lower than expected. However, the average return over the ten-year period from 2013 to 2022 was 7.7%.
Other Post-Employment Benefits
The Cook County Pension Fund administers a Postemployment Group Healthcare Benefit Plan (PGHBP) that provides healthcare and vision benefits for annuitants who elect to participate and their dependents. In FY2022 there were 18,107 active members and 11,573 retirees or other beneficiaries receiving benefit payments. The plan is administered through a trust, but is funded on a “pay-as-you-go” basis. This means that neither the Pension Fund nor Cook County are accumulating assets to pay for future OPEB benefits. Instead, benefit expenses are paid for as they come due. In FY2022 $44.3 million of the County’s pension contribution was dedicated to OPEB costs. The PGHBP expects employees and spouse annuitant contributions to cover 56% of annual medical costs.
Pension funds and governments are required to report information in their financial statements about OPEB liabilities, assets (if any) and expenses. Cook County reported total OPEB liability to be $1.66 billion as of December 31, 2022. The reported OPEB liability represents a net decrease of $316.9 million from the prior year due to a decrease in the discount rate used to calculate the benefits and growth in costs from 2.12% to 2.05%.
The OPEB liability as calculated for financial reporting purposes is different from how Cook County values OPEB liabilities under State law. While the County’s OPEB liability for financial reporting is calculated using a lower discount rate of 2.05% in FY2021, State law requires pension and OPEB liabilities to be valued at the same discount rate as pension liabilities, or 7.0% in FY2021. The sum of the pension and OPEB liabilities reported according to GASB standards is therefore higher than the total liabilities reported in the statutorily required valuations of the Cook County pension fund required pursuant to Illinois statute.
For more information about the Cook County pension fund and the pension metrics discussed in this blog, see the Civic Federation’s Status of Local Pension Funding FY2012 report.
[1] The Civic Federation calculates investment rate of return using the following formula: Current Year Rate of Return = Current Year Gross Investment Income/ (0.5*(Previous Year Market Value of Assets + Current Year Market Value of Assets – Current Year Gross Investment Income)). This is not necessarily the formula used by the pension funds’ actuaries and investment managers; thus investment rates of return reported here may differ from those reported in a fund’s actuarial statements. However, it is a standard actuarial formula. Gross investment income includes income from securities lending activities, net of borrower rebates. It does not subtract out related investment and securities lending fees, which are treated as expenses.